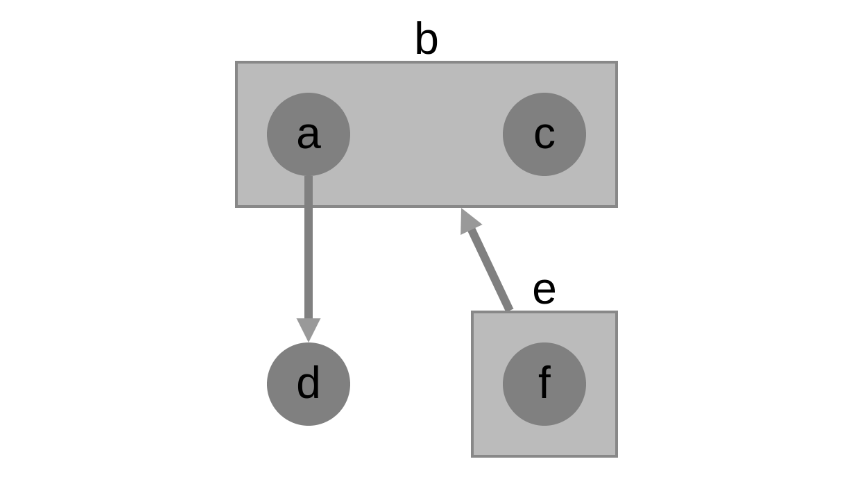
Compound Nodes
This graph is a demo showing the implementation of compound nodes in GraphSpace. You can construct this graph in graphspace_python by the following steps:
Importing necessary modules
You have to import the GSGraph
class to construct a graph and GraphSpace client
class to upload the graph to GraphSpace.
>>> from graphspace_python.graphs.classes.gsgraph import GSGraph
>>> from graphspace_python.api.client import GraphSpace
Initialize GraphSpace client
You have to initialize the GraphSpace client by providing your username and password.
>>> graphspace = GraphSpace('user1@example.com', 'user1')
Set name,tags and visibility status
Using the mothods of the GSGraph class you can set name, tags and visibility status for your newly created graph.
>>> G.set_name('Compound Nodes')
>>> G.set_tags(['compound-nodes', 'graphspace', 'demo'])
>>> G.set_is_public()
Define meta-data
Meta data for the graph can be set in the following way:
>>> data = {
>>>     'description': 'This is a demo graph having compund nodes. You can also view this demo graph at:\
>>>  <a href=\"http://js.cytoscape.org/demos/compound-nodes/\">http://js.cytoscape.org/demos/compound-nodes/</a>',
>>>     'directed': True
>>> }
>>> G.set_data(data)
Adding nodes to the graph
You can add nodes to the graph using the add_node()
method available in the GSGraph class.
>>> G.add_node('a', parent='b')
>>> G.add_node('b')
>>> G.add_node('c', parent='b')
>>> G.add_node('d')
>>> G.add_node('e')
>>> G.add_node('f', parent='e')
Set node positions
After adding the nodes you can set their positions(x,y coord) in the following way:
>>> G.set_node_position('a', x=215, y=85)
>>> G.set_node_position('c', x=300, y=85)
>>> G.set_node_position('d', x=215, y=175)
>>> G.set_node_position('f', x=300, y=175)
Adding edges to the graph
You can add edges to the graph using the add_edge()
method available in the GSGraph class.
>>> G.add_edge('a', 'd')
>>> G.add_edge('e', 'b')
Set styling for the graph elements
You can assign style to the added nodes and edges in the following manner:
>>> G.add_style('node', {
>>>     "content": "data(id)",
>>>     "text-valign": "center",
>>>     "text-halign": "center",
>>>     "background-color": "grey"
>>> })
>>> G.add_style('$node > node', {
>>>     "padding-top": "10px",
>>>     "padding-left": "10px",
>>>     "padding-bottom": "10px",
>>>     "padding-right": "10px",
>>>     "text-valign": "top",
>>>     "text-halign": "center",
>>>     "background-color": "#bbb"
>>> })
>>> G.add_style('edge', {
>>>     "target-arrow-shape": "triangle",
>>>     "line-color": "grey"
>>> })
Upload graph to GraphSpace
Finally, you can upload the graph to GraphSpace.
>>> graph = graphspace.post_graph(G)
>>> graph.url
'http://graphspace.org/graphs/32708'
This demo graph is already present on GraphSpace. You can view it at http://graphspace.org/graphs/22776