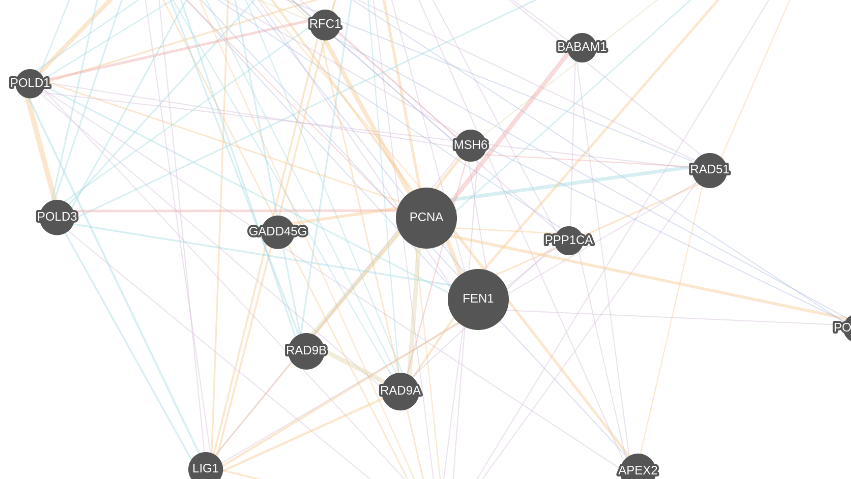
Gene-Gene Graph
Gene-gene graph is a demo graph showing the interactions between various genes. You can construct this graph in graphspace_python by the following steps:
Importing necessary modules
You have to import the GSGraph
class to construct a graph, GraphSpace client
class to upload the graph to GraphSpace, and other necessary modules (urllib and json).
>>> import urllib
>>> import json
>>> from graphspace_python.graphs.classes.gsgraph import GSGraph
>>> from graphspace_python.api.client import GraphSpace
Initialize GraphSpace client
You have to initialize the GraphSpace client by providing your username and password.
>>> graphspace = GraphSpace('user1@example.com', 'user1')
Fetch graph data
You can fetch the structural data of the gene-gene graph, consisting of its nodes and edges, present in the Cytoscape.js repository, by using urllib and json module.
>>> data_url = 'https://raw.githubusercontent.com/cytoscape/cytoscape.js/master/documentation/demos/colajs-graph/data.json'
>>> response = urllib.urlopen(data_url)
>>> graph_data = json.loads(response.read())
Fetch style data
Similarly, you can fetch the style data of the gene-gene graph, consisting of style of its nodes and edges, present in the Cytoscape.js repository, by using urllib and json module.
>>> data_url = 'https://raw.githubusercontent.com/cytoscape/cytoscape.js/master/documentation/demos/colajs-graph/cy-style.json'
>>> response = urllib.urlopen(data_url)
>>> style_data = json.loads(response.read())
Set name,tags and visibility status
Using the mothods of the GSGraph class you can set name, tags and visibility status for your newly created graph.
>>> G.set_name('Gene-gene graph')
>>> G.set_tags(['gene-gene', 'graphspace', 'demo'])
>>> G.set_is_public()
Define meta-data
Meta data for the graph can be set in the following way:
>>> data = {
>>>     'description': 'This is a demo of a graph of gene-gene interactions.<br>View functional demo of this graph at:\
>>>  <a href=\"http://js.cytoscape.org/demos/colajs-graph/\">http://js.cytoscape.org/demos/colajs-graph/</a>',
>>>     'directed': False
>>> }
>>> G.set_data(data)
Construct nodes and edges of graph from graph data
The fetched graph data is an array of elements where each element is either a node or edge. To properly construct the graph from the data, add nodes and edges to the graph by checking whether the element is a node or edge. Morever if the element is a node, add a popup text (containing the link to the gene type) that is to be shown when the node is tapped on.
>>> for elem in graph_data:
>>>     if elem['group'] == 'nodes':
>>>         popup = ("<a target=\"_blank\" href=\"http://www.genecards.org/cgi-bin/carddisp.pl?gene=" + elem['data']['name']
>>>                 + "\">GeneCard</a><br><a target=\"_blank\" href=\"http://www.uniprot.org/uniprot/?query=" + elem['data']['name']
>>>                 + "&fil=organism%3A%22Homo+sapiens+%28Human%29+%5B9606%5D%22&sort=score\">UniProt search</a><br><a target=\"_blank\" href=\"http://genemania.org/search/human/"
>>>                 + elem['data']['name'] + "\">GeneMANIA</a>")
>>>         G.add_node(nodeelem['data']['id'], elem['data'], label=elem['data']['name'], popup=popup)
>>>         G.set_node_position(elem['data']['id'], elem['position']['y'], elem['position']['x'])
>>>     else:
>>>         G.add_edge(elem['data']['source'], elem['data']['target'], elem['data'])
Set styling for graph elements
Using the fetched style data you can define the style_json for the graph. As during creating nodes, label is assigned to the nodes from the graph data, there is no need of the attribute content in the style attributes of the nodes. So styling can be set in the following way:
>>> del(style_data[1]['style']['content'])
>>> style_json = {
>>>     'style': style_data
>>> }
>>> G.set_style_json(style_json)
Upload graph to GraphSpace
Finally, you can upload the graph to GraphSpace.
>>> graph = graphspace.post_graph(G)
>>> graph.url
'http://graphspace.org/graphs/32708'
This demo graph is already present on GraphSpace. You can view it at http://graphspace.org/graphs/22710