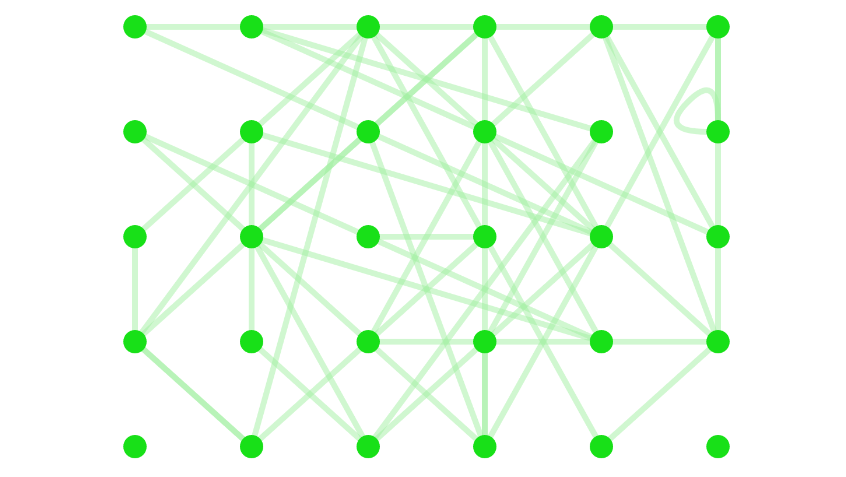
Grid Layout
This graph is a representation of a grid arrangement of nodes. You can construct this graph in graphspace_python by the following steps:
Importing necessary modules
You have to import the GSGraph
class to construct a graph, GraphSpace client
class to upload the graph to GraphSpace, and other necessary modules (urllib and json).
>>> import urllib
>>> import json
>>> from graphspace_python.graphs.classes.gsgraph import GSGraph
>>> from graphspace_python.api.client import GraphSpace
Initialize GraphSpace client
You have to initialize the GraphSpace client by providing your username and password.
>>> graphspace = GraphSpace('user1@example.com', 'user1')
Fetch graph data
You can fetch the structural data of the Grid Layout graph, consisting of its nodes and edges, present in the Cytoscape.js repository, by using urllib and json module.
>>> data_url = 'https://raw.githubusercontent.com/cytoscape/cytoscape.js/master/documentation/demos/grid-layout/data.json'
>>> response = urllib.urlopen(data_url)
>>> graph_data = json.loads(response.read())
Set name,tags and visibility status
Using the mothods of the GSGraph class you can set name, tags and visibility status for your newly created graph.
>>> G.set_name('Grid Layout')
>>> G.set_tags(['grid-layout', 'graphspace', 'demo'])
>>> G.set_is_public()
Define meta-data
Meta data for the graph can be set in the following way:
>>> data = {
>>>     'description': 'This is a demo graph having grid layout. You can also view this demo graph at:\
>>>  <a href=\"http://js.cytoscape.org/demos/grid-layout/\">http://js.cytoscape.org/demos/grid-layout/</a>',
>>>     'directed': False
>>> }
>>> G.set_data(data)
Construct nodes and edges of graph from graph data
The fetched graph data is an array of elements where each element is either a node or edge. To properly construct the graph from the data, add nodes and edges to the graph by checking whether the element is a node or edge.
>>> for elem in graph_data:
>>>     if elem['group'] == 'nodes':
>>>         G.add_node(elem['data']['id'], elem['data'])
>>>         G.set_node_position(elem['data']['id'], elem['position']['y'], elem['position']['x'])
>>>     else:
>>>         G.add_edge(elem['data']['source'], elem['data']['target'], elem['data'])
Set styling for graph elements
You can define style for the nodes and edges of the graph in the following manner:
>>> G.add_style('node', {
>>>     'height': 20,
>>>     'width': 20,
>>>     'background-color': '#18e018'
>>> })
>>> G.add_style('edge', {
>>>     'curve-style': 'haystack',
>>>     'haystack-radius': 0,
>>>     'width': 5,
>>>     'opacity': 0.5,
>>>     'line-color': '#a2efa2'
>>> })
Upload graph to GraphSpace
Finally, you can upload the graph to GraphSpace.
>>> graph = graphspace.post_graph(G)
>>> graph.url
'http://graphspace.org/graphs/32708'
This demo graph is already present on GraphSpace. You can view it at http://graphspace.org/graphs/22736